The Role of Payer Mix in Access Strategies for Complex Therapeutic Areas
Summary
With IRA, MFN, and OBBBA pressures, manufacturers must assess coverage shifts, demographics, and payer mix to refine channel strategy and improve patient access.Background
Manufacturers are navigating changes to payment models driven by four major policy shifts that affect both pipeline and established products, requiring strategic adjustments:
Inflation Reduction Act (IRA) Part D Benefit Redesign: Manufacturers in Medicare-dominated areas with Part D drugs will see patients facing higher out-of-pocket (OOP) costs. Therapeutic areas (TAs) with more Medicare beneficiaries will have broader access and uptake impacts, while those with fewer will see more limited effects.
One Big Beautiful Bill Act (OBBA): Manufacturers may see payer mix shift from Medicaid to more commercial/uninsured patients, impacting uptake dynamics and economics. This could also affect state TA prioritization, requiring active Medicaid engagement to maintain focus.
Direct-to-Consumer (DTC) Pricing Program: Manufacturers may need to redesign channel and access strategies without pharmacy benefit managers. Products with broader DTC channels can serve as analogs, while payer mix insights help identify patients at higher cost risk who may shift to DTC.
Most-Favored Nation (MFN) Pricing: With MFN pricing pressures, manufacturers must anticipate strategic implications. Understanding payer mix across portfolios helps prioritize pricing shifts and gauge channel exposure. Real-time insights support scenario planning, flag pipeline risks, and guide patient support program (PSP) redesign to preserve affordability and access.
- Learn more: Avalere Health Experts React to the Most-Favored Nation Executive Order; Webinar: The Future of Drug Pricing: How MFN Could Reshape the Market
Given evolving market and policy pressures, it is especially critical for manufacturers to understand implications of the payer mix to design effective channel strategies. This may involve portfolio-level pricing, restructuring PSPs) or pursuing justified list price increases.
Analysis
In a previous payer mix analysis, we examined rare autoimmune diseases. This installment expands to oncology and autoimmune conditions, focusing on channel, coverage, and access considerations using 2020 data, with illustrative examples of how policy updates shape the market.
Avalere Health used 2020 data to conduct an analysis of four disease populations (oncology and rare autoimmune) to assess payer mix by demographics and disease characteristics, focusing on Medicare coverage. Results showed significant disease-specific differences, emphasizing the need for tailored payer engagement. With Part D redesign shifting catastrophic costs to patients and manufacturers, these insights are critical for anticipating financial exposure and shaping cost-sharing, rebates, and contracting.
Comparing Medicare coverage to national averages, the analysis found variations by age and gender, reinforcing the value of incorporating demographic and disease-driven payer mix into access strategies to improve targeting and patient access (Table 1).
Table 1. Demographic Analysis of Patient Population
| Patient Population | % Reduction from Previous Number of Codes | ABC | |
|---|---|---|---|
| A | Rapidly progressing, high mortality disease type | 40% | 60% |
| B | Rare, complex and high mortality disease type | 51% | 26% |
| C | Rare, chronic disease affecting the CNS | 86% | 81% |
| D | Rare inflammatory, immune disease | 73% | 77% |
| Total Population – 2020 | N/A | 76% | 50.8% |
Figure 1. Medicare VS Non-Medicare Payer
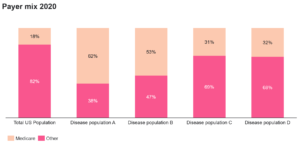
Disease population A was mostly older (i.e., over 65), male, and had a high rate of Medicare enrollment. Disease population Population B is characterized by a rare, severe, high-mortality disease in younger patients, with high rates of Medicare coverage via disability. It is also mostly male. Individuals in these groups would not be subject to redesign but would be exposed to MFN pressures.
Disease populations C and D are predominantly female and under 65, yet with high Medicare coverage that is likely tied to severity or dual eligibility. For Population C, Part D coverage may trigger redesign impacts, requiring OOP and PSP adjustments for the 31% on Medicare.
By contrast to the samples studies, about 76% of the US population is under 65 and 50.8% of the population is female (Census 2020). The demographic differences across the disease populations show how age, gender, and disease characteristics drive payer mix and channel strategy.
Key Considerations
Payer mix dynamics shape access, coverage, and patient burden. Claims data stratified by product, analogs, and populations reveal barriers and guide reimbursement pathways. Because policy shifts affect populations differently, payer mix insights inform both pipeline planning and lifecycle management—supporting payer engagement, PSP design, DTC strategy, and financial exposure planning. Tailored strategies also help anticipate shifts associated with the IRA, MFN, and Part D redesign, with significant implications for Populations B and D. These insights enable refinement of PSPs and channel strategies to sustain access.
To learn more about how Avalere Health can help optimize access strategies, connect with us.
Methodology
Avalere performed this analysis using 100% Medicare Fee-for-Service (FFS) claims, accessed by Avalere Health via a research collaboration with Inovalon, Inc., and governed by a research-focused Center for Medicare & Medicaid Services data use agreement. This includes the 100% sample of Medicare Part A and Part B Medicare FFS claims data and the 100% sample of Part D prescription drug event data for all Part D plans (including Medicare Advantage Part D plans). In addition, Avalere Health used data from Inovalon’s proprietary “Medical Outcomes Research for Effectiveness and Economics” (MORE2) Registry® (2021-2023), accessed by Avalere Health via an Agreement with Inovalon, Inc.
The Inovalon MORE2 Registry® is a real-world database that is inclusive of medical and pharmacy claims sourced by over 140 health plans and statistically de-identified. The MORE2 Registry® contains all major US payer lines of business including commercial (42% of market), Medicare Advantage (25% of market), and Managed Medicaid (69% percent of market).
Services
produces measurable results. Let's work together.