Part D Formulary Management Tightens in 2026
Summary
Coverage for top brand drugs is tightening slightly in 2026, along with increased utilization management and continued shifts from copays to coinsurance.On November 5, the Centers for Medicare and Medicaid Services (CMS) released the 2026 Part D formulary files. Together with the plan landscape files, these data show how Part D plans are adjusting their strategies is response to Part D benefit redesign, broader policy and market changes, and new dynamics for drugs with Maximum Fair Prices (MFPs) established through the Medicare Drug Price Negotiation Program in 2026.
Drug Coverage
Coverage trends differ for top generic vs. brand drugs. Across the top 100 brand drugs by Part D drugs spend, coverage is declining slightly in 2026, decreasing by two percentage points for individual Medicare Advantage Prescription Drug plans (MA-PDs) and one percentage point for standalone Prescription Drug Plans (PDPs). However, MA-PDs continue to cover a higher share of top drugs compared to PDPs (Figure 1).
Figure 1: Average Percentage of Top 100 Brand Drugs Covered vs. Not Covered Among MA-PDs and PDPs, 2025 vs. 2026
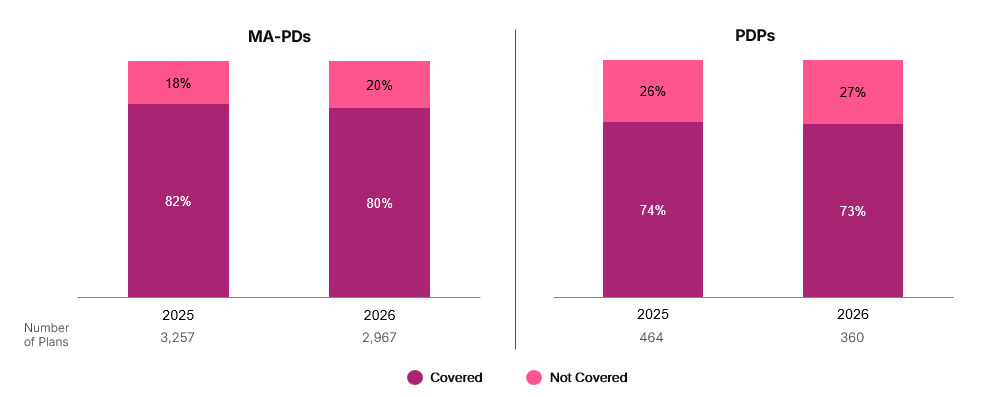
By contrast, coverage for the top 100 generic drugs by Part D spending rose for both PDPs (84% to 85%) and MA-PDs (88% to 89%) between 2025 and 2026.
Cost Sharing
The biggest shifts in formulary management among Part D plans continue to be in cost sharing. In 2026, the share of plans with three or more coinsurance tiers will increase by 22 percentage points for MA-PDs and by seven percentage points for PDPs (Figure 2). This builds on shifts from 2024 to 2025, when the share of plans with three or more coinsurance tiers increased by 32 percentage points for MA-PDs and 26 percentage points for PDPs. Prior to 2025, most MA-PDs (82% in 2024) only had one coinsurance tier.
Figure 2: Percentage of MA-PDs and PDPs by Number of Coinsurance Tiers, 2025 vs. 2026 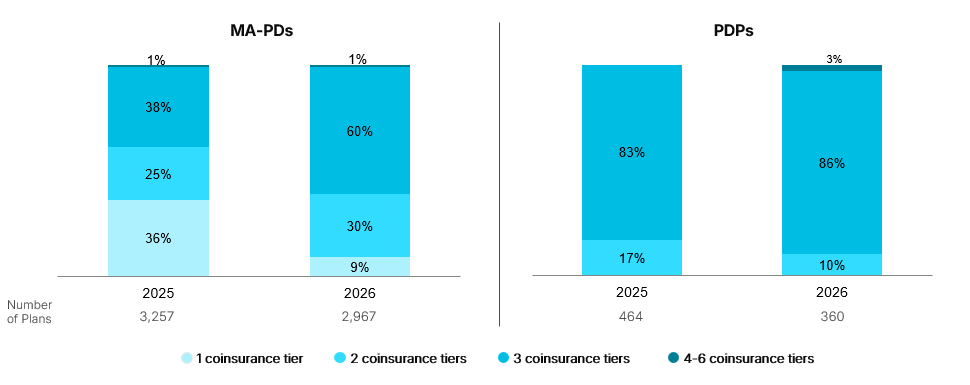
Most covered drugs are now placed on coinsurance tiers for both PDPs and MA-PDs. The average share of all drugs on coinsurance tiers is increasing from 48% in 2025 to 63% in 2026 for MA-PDs and from 76% to 79% for PDPs. Since 2023, the average percentage of all drugs covered on coinsurance tiers has increased by 35 percentage points for MA-PDs and 14 percentage points for PDPs.
Utilization Management (UM)
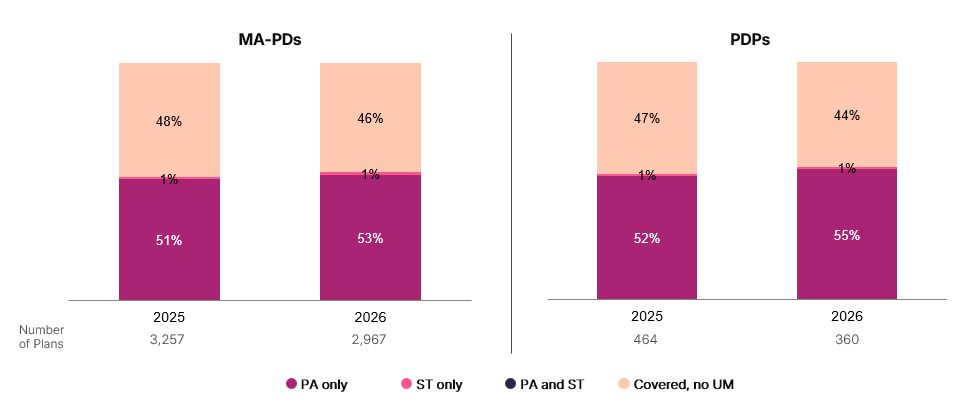
Use of prior authorization (PA) for covered brand drugs is continuing to increase in 2026, rising by an average of three percentage points for PDPs and two percentage points for MA-PDs, following similar increases in PA from 2024 to 2025. Rates of PA remain slightly higher for PDPs than MA-PDs (Figure 3).
Figure 3. Average Percentage of Covered Brand Drugs by Utilization Management Tool Among MA-PDs and PDPs, 2025 vs. 2026
Variations by Therapeutic Area and Region and Management of MFP Drugs
As in previous years, shifts in coverage, cost sharing, and UM may be more substantial for some products and therapeutic areas compared to others, particularly given the introduction of MFPs. These changes are also likely to differ by plan type and region.
Avalere Health’s initial analysis of management for MFP drugs across all Part D plans between 2025 and 2026 found increased UM for some products, including new step therapy requirements for one product and slight shifts in tier placement for other products. As MFPs reshape the pricing environment in therapeutic classes with negotiated products, plans may also be shifting management for non-negotiated competitors and making proactive changes for 2027 negotiated products and their alternatives.
With MFPs for the 2027 cohort of negotiated drugs expected to be announced in the coming weeks, stakeholders should also consider how CMS’s evolving approach to setting MFPs, along with Most-Favored Nation (MFN) pricing pressures, may affect plan managements strategies and broader market pricing dynamics in future years.
With further reductions in Part D plan choices, the changing plan and formulary landscape is likely to have an even greater effect in shaping patient access, contracting strategies, and competitive positioning in 2026 and beyond.
To learn more about the impacts of evolving Part D market, connect with us.
Methodology
Avalere Health used the Part D formulary files released by CMS. The top 100 generic and brand drugs by Part D spending were identified based on the top drugs by Part D spending in the first six months of 2025 using Prescription Drug Event data. Results for MA-PDs exclude Special Needs Plans. Results also exclude territories, Employer-Group Waiver Plans, Special Needs Plans, Cost plans, Medicare-Medicaid Plans, and Program of All-Inclusive Care for the Elderly plans.
Services
produces measurable results. Let's work together.