RxHCC Model May Not Accurately Predict Costs for Certain TAs
Summary
Avalere analysis finds that the Part D risk adjustment model likely underpredicts expenditures for some high-cost conditions.Background
The Inflation Reduction Act (IRA) significantly redesigns the Part D benefit in 2025 and changes liability between stakeholders, including beneficiaries, manufacturers, and plans. Under Part D redesign, plans will assume additional liability in the catastrophic phase where plan liability will increase from 15% in 2023 to 60%. Additionally, Part D redesign eliminates the coverage gap leaving plans liable for 65% of drug spending that falls in the initial coverage phase (i.e., spending that falls below the new $2,000 cap under Part D redesign).
In addition to greater plan liability overall, the IRA changes will shift Centers for Medicare & Medicaid Services (CMS) payments to Part D plans from majority reinsurance payments to majority risk-adjusted direct subsidy payments, placing a new importance on the Part D risk adjustment (RxHCC) model. The higher proportion of plan payments subject to the risk adjustment model relative to all Part D plan costs increases the importance of the RxHCC model accurately predicting the expected costs of members.
RxHCC Model Performance Varies by Level of Risk
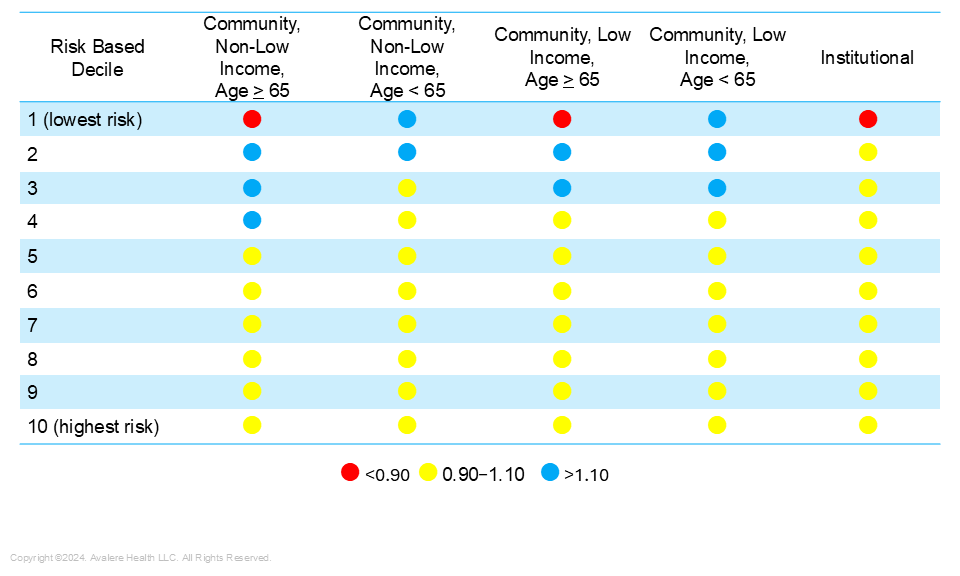
RxHCC model performance is often measured using the predictive ratio, which is the ratio of predicted Part D plan liability under the model to actual liability. Perfect prediction is 1, and a predictive ratio between 0.9 and 1.1 is considered relatively accurate. When the risk adjustment model is revised or a new model is announced, CMS publishes the model’s predictive ratios in the Advance Notice. The ratios are calculated across all Part D enrollees and then calculated within risk deciles. Risk deciles are created by arraying all Part D enrollees by risk score (low to high) and creating ten equal groups with the highest decile having the highest risk scores. Generally, the model performs more accurately for higher risk enrollees because they have claims across multiple conditions (i.e. more HCCs), thus more information to input into the model.
In the calendar year 2025 Advance Notice, CMS reported a predictive ratio close to 1 for enrollees in the fifth decile or higher. For most of the lower risk deciles (fourth, third, and second deciles), the risk ratio is greater than 1, signifying that the Part D plan liability predicted by the model was greater than actual plan liability. The first decile is the least accurate, with a predictive ratio of 0.569 signifying that the actual costs incurred were much greater than those predicted for this group. Beneficiaries in the first decile have the lowest risk scores, meaning they have few or no claims for the conditions underlying the risk model and their risk score will be mainly impacted by their demographic characteristics (e.g., age, sex, dual Medicaid status).
Figure 1: CMS Advance Notice Risk Decile Predictive Ratios
RxHCC Model Accuracy for Therapeutic Area-Specific Risk Scores
CMS has not released an assessment of how well the model predicts costs for enrollees based on specific health conditions. To examine the accuracy of the RxHCC model by subgroup, Avalere used Part D Event data to examine the RxHCC model’s performance for Medicare beneficiaries taking drugs across 7 therapeutic areas (TAs). TAs were selected for having high gross drug costs and utilization.
TAs With the Highest Risk Scores Have the Lowest Predictive Ratios
Avalere found that average risk scores were higher for beneficiaries who took hematopoietic (blood cell formation) agents than they were for beneficiaries not taking hematopoietic agents. Similarly, they were higher for beneficiaries taking antivirals and gastrointestinal agents. While still above 1, risk scores were lower for beneficiaries taking anticoagulants or psychotherapeutic agents (Figure 2).
Figure 2: Average Risk Score for Beneficiaries by TA
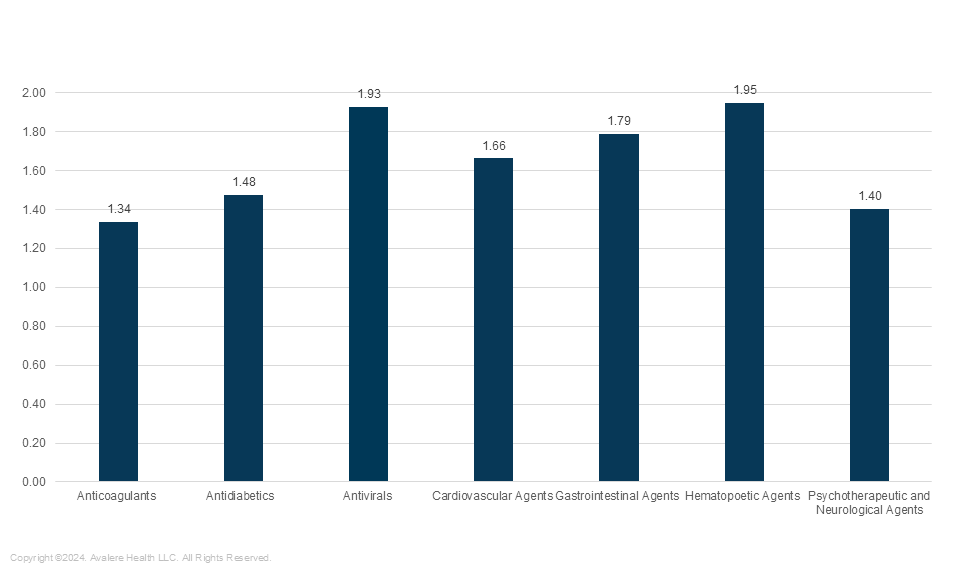
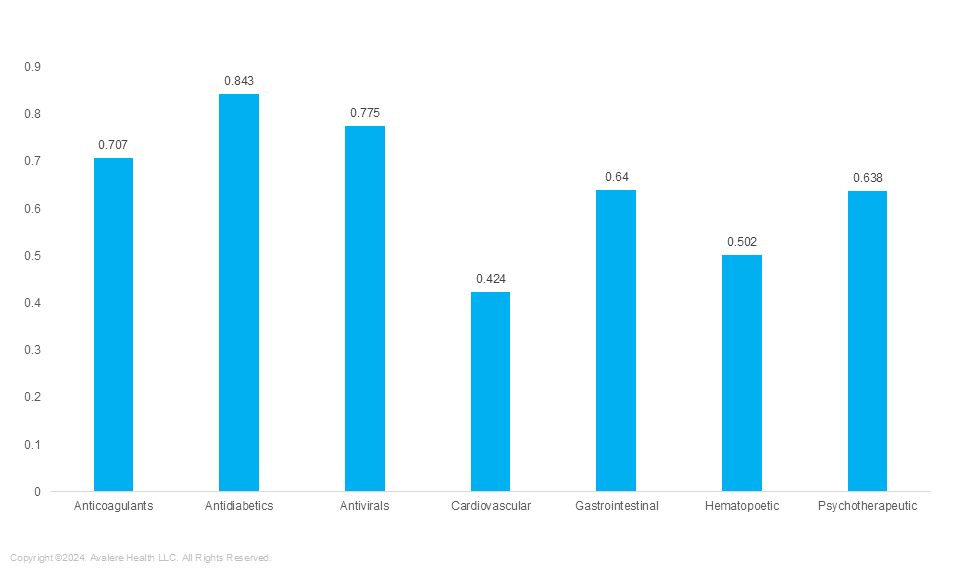
TAs with the highest risk scores have some of the lowest predictive ratios (meaning that the actual liability is higher than that predicted using the RxHCC model). In the full population, higher risk beneficiaries (i.e., those in higher risk deciles) have predictive ratios closer to 1. However, in some of the TAs with the highest average risk scores, the predictive ratios are much lower than 1. For example, the average risk score for beneficiaries taking hematopoietic agents is 1.95, meaning they are predicted to incur drug costs nearly 2 times the average in plan liability, but the predictive ratio is 0.502, meaning their actual plan liability was 2 times higher than what was predicted. Risk scores for beneficiaries taking antidiabetics was higher than 1; however the RxHCC model prediction was close to 1 (0.843). This means the predictive plan liability for these beneficiaries was close to their actual incurred liability (Figure 3).
Figure 3: Average Predictive Ratios Using RxHCC Model (2025) by TA
Conclusions
Since implementation of the IRA in 2024, the RxHCC risk model has increased importance. On average across all enrollees, the model performance is accurate, with the average predictive value close to the average actual value. The model is more accurate for higher risk beneficiaries, as there is more data for the model to use in making a prediction. However, the model is not as accurate for beneficiaries taking drugs in certain TAs, including some TAs with individuals at very high risk of incurring high drug costs. One reason this could be is that the RxHCC model is calibrated using medical conditions/claims to predict drug costs. If the predictive ratios are less accurate for subgroups of beneficiaries taking drugs in certain TAs, it could be because use of these expensive drugs are not well predicted using medical claims history. Given the importance of the risk adjustment model, it is important that stakeholders pay attention to the RxHCC model performance for specific populations.
Methods
Avalere performed this analysis using 100% Medicare fee-for-service (FFS) claims, accessed by Avalere via a research collaboration with Inovalon, Inc., and governed by a research-focused CMS data use agreement. This includes the 100% sample of Medicare Part A and Part B Medicare FFS claims data.
Actual spending was calculated using total spending from the 2019 Part D Event file as an input in Avalere’s proprietary model simulating IRA benefit structure. Costs were inflated using drug spending trends from the Medicare Trustees Report. Risk scores were generated using v24 HCC software from CMS for 2025. The 2025 predicted amount was calculated as the product of risk scores and the CMS denominator. Risk deciles were created based on the array of risk scores and then Avalere calculated predictive ratios within the risk deciles as the ratio of predicted to actual spending.
Members who had a prescription for a drug in a TA were assigned to the TA regardless of other conditions and TA assignment was not mutually exclusive in that members taking multiple drugs could be assigned to more than 1 TA.
Services
produces measurable results. Let's work together.