Claim Denials Vary by Specialty in Traditional Medicare
Summary
Our analysis of 2023 fee-for-service (Traditional) Medicare claims denials found variations in the percentage and volume across specialty type.Avalere Health conducted an analysis of 100% Medicare fee-for-service 2023 claims data to observe trends in claim denials across provider specialties. We assessed claim denials by total number of claims as well as percentage of total claim volume for each specialty. Figure 1 below summarizes our findings.
Figure 1: Claim Denials by Provider Specialty in Traditional Medicare
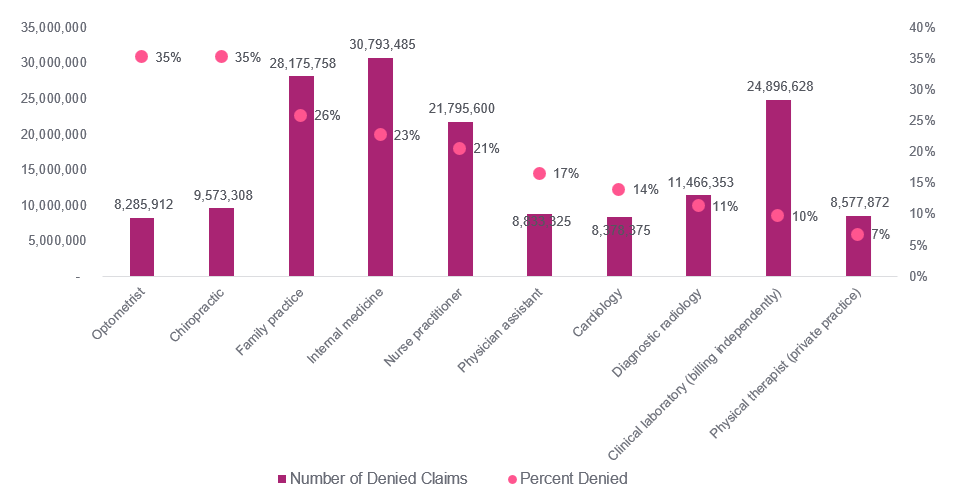
We found that both the number of denied claims and the percentage of claims that are denied vary by specialty in Traditional Medicare. While optometry and chiropractic services had among the lowest number of denied claims, they had the highest percentage of denied claims among the specialties we examined (35% each). High denial rates in chiropractic services and optometry may be related to lack of coverage in Traditional Medicare. There are many chiropractic services (e.g., massages, acupuncture, etc.) and eye services (e.g., routine exams, contacts) that Traditional Medicare does not cover.
Physical Therapy and clinical laboratory services had the lowest denial rate (7% and 10% respectively), although by total number of claims denied, clinical laboratory had the third most denials of the specialties examined.
These findings highlight that claim denial patterns in Traditional Medicare differ meaningfully across provider specialties, both in volume and rate. Specialties with high denial rates may largely reflect Medicare’s structural coverage limitations rather than billing errors, while high-volume specialties like internal medicine and clinical laboratory services drive the greatest absolute number of denials. Providers and policymakers should consider these distinctions when evaluating denial trends to better target administrative improvements, patient education, and potential coverage policy reforms.
Methodology
Avalere Health conducted an analysis of 100% Medicare fee-for-service 2023 claims data to observe trends in claim denials across specialties. We identified denials by claim line in the professional claims using the Line Processing Indicator Code and in the outpatient settings by Revenue 1st American National Standards Institute (ANSI) Code. The Line Processing Indicator Code is “the code on a non-institutional claim indicating to whom payment was made or if the claim was denied.” The Revenue Center 1st ANSI Code is “the first code used to identify the detailed reason an adjustment was made (e.g. reason for denial or reducing payment)”. We assessed claim denials by total number of claims as well as percentage of total claim volume for each specialty. Since more than 20% of Medicare FFS beneficiaries had at least one denied claim in our years of analysis, we took a 20% sample of beneficiaries and extrapolated results for the beneficiary population.
Services
produces measurable results. Let's work together.